NHL scoring trends over time
This page is for those looking to reaserch or get insights into league trends: how NHL league rules have effected play in NHL's past, and how to look for future trends in the same field. More specifically, the page will focus on NHL scoring trends over time and the impact of rule changes on scoring.
my data comes from three different pages:
How to Use These Resources
The three data resources listed above give fans, analysts, and researchers different angles for understanding NHL scoring trends:
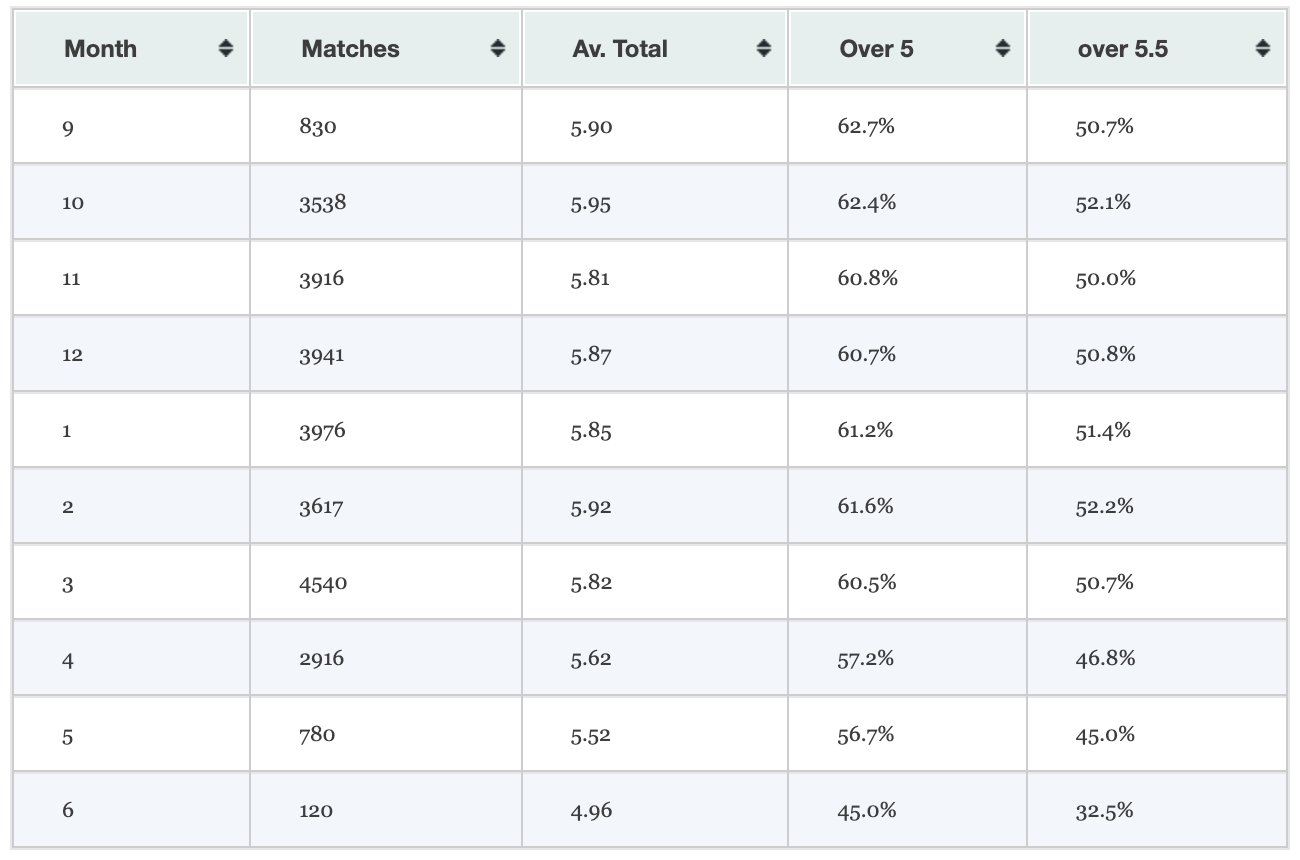
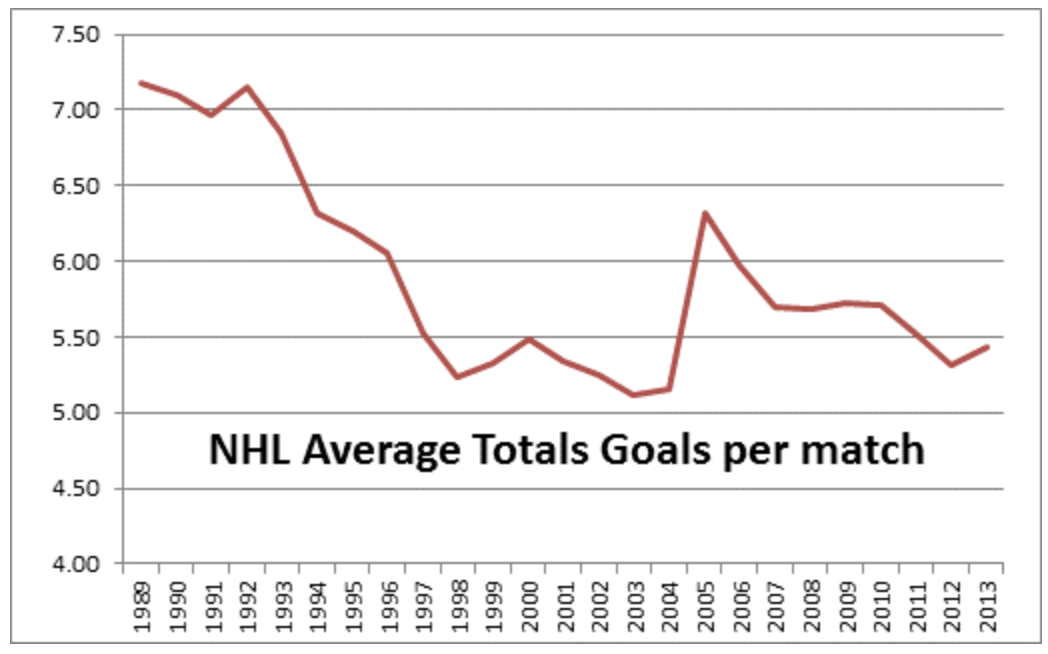
- Sportpunter provides historical averages of goals per game, broken down by month and season. This is useful if you want to see league-wide scoring trendsover time, or identify if offense rises or falls during certain periods of the season.
- Hockey Reference contains detailed player and team statistics. With this, a user can dive into individual player performance (goals, assists, power-play scoring) and compare those numbers to league averages.
- Hockey Analytics offers deeper context, especially around how rule changes (such as removing the two-line pass restriction or modifying goalie equipment) have influenced gameplay across eras.
Sportpunter's graph showing a jump in scoring after 2005 (Source)
Together, these sources let a consumer move from a big-picture view of league scoring (Sportpunter), to player-by-player breakdowns (Hockey Reference), and finally to an understanding of external factors that drive those trends (Hockey Analytics). For example, a coach might use them to identify whether a player's drop in scoring is part of a league-wide trend or something unique to that player.
Sample Analysis: Are Rule Changes Driving Higher Scoring?
Here's an example of how a researcher could combine all three resources to draw real insights:
- Start with Sportpunter: Look at the average goals-per-game graph over the last twenty years. You'll notice a sharp increase in goals-per-game beginning in the 2005-06 season. This suggests a possible structural change in the league.
- Check Hockey Analytics: Their breakdown of “eras of the NHL” confirms that in 2005-06, the league introduced new rules (including stricter obstruction penalties and removal of the two-line pass). This context helps explain why the spike occurred.
- Validate with Hockey Reference: Pull up the team and player statistics for that same season. For example, you can compare Sidney Crosby's rookie year (2005-06) to Mario Lemieux's final season in 2005-06, and notice how both played in a suddenly faster, higher-scoring environment.
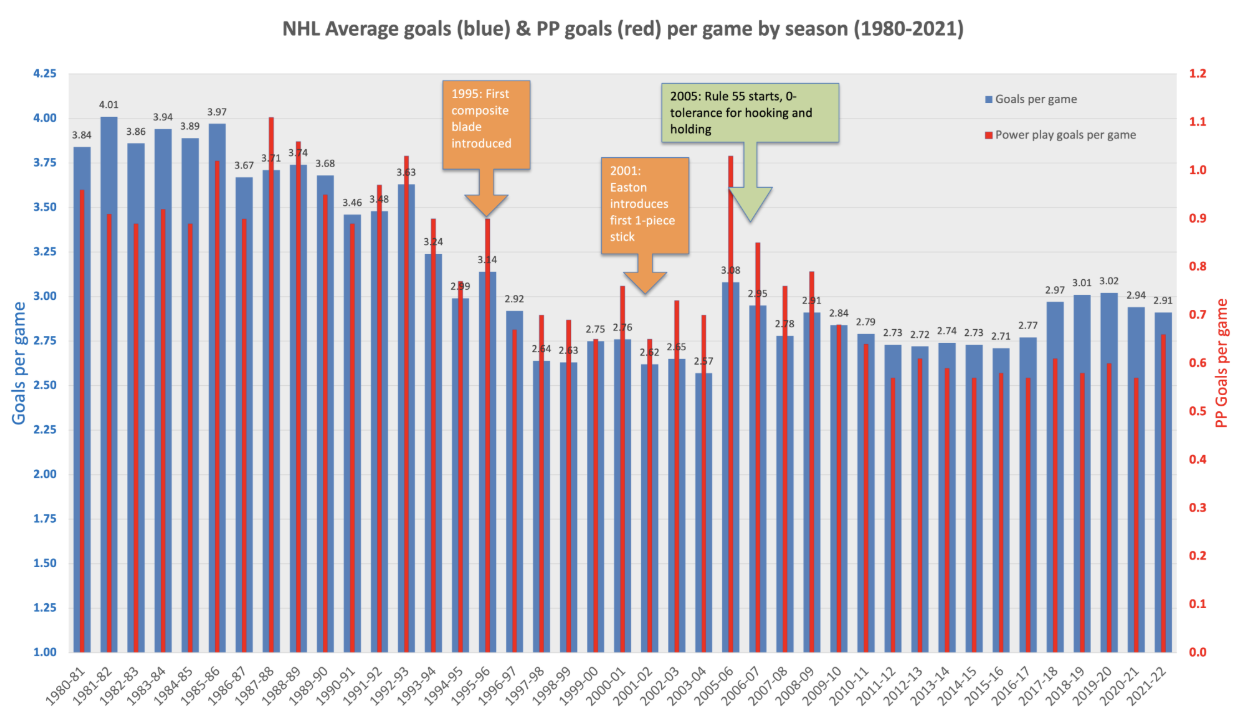
By tying these three sources together, the analyst confirms that the scoring increase wasn't just a coincidence—it was directly tied to league-wide rule changes. A user could apply this same process to more recent trends, such as the rise in power-play effectiveness, to see whether they are linked to tactical evolution, officiating changes, or shifts in player skill.